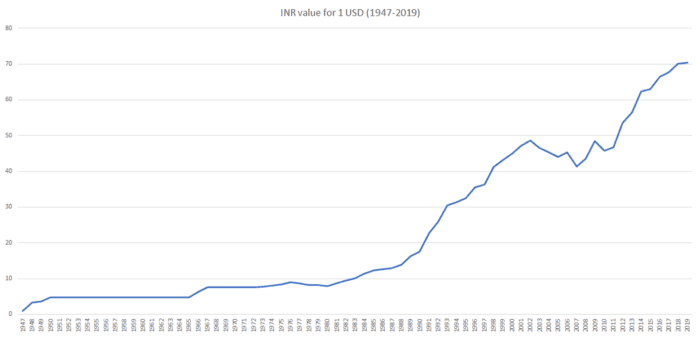
Exchange-rate regimes changed over time
India’s exchange-rate framework has changed substantially since independence. The rupee moved through periods influenced by fixed or managed arrangements, official devaluations, balance-of-payments pressure, economic reforms, and a more market-determined system with central-bank intervention.
A single long-run chart can hide those regime changes. Historical comparisons should therefore identify the time period and data series rather than treating every movement as the result of one factor.
Why USD-to-INR moves
These forces interact, and a plausible explanation after a move is not a dependable forecast of the next one. Use Reserve Bank of India and Federal Reserve data for historical research, noting each series’ frequency and methodology.
- Differences in inflation and interest-rate expectations.
- Trade, investment, and other balance-of-payments flows.
- Demand for U.S. dollars in global markets.
- Risk sentiment and major economic or geopolitical events.
- Market liquidity and central-bank operations.
Historical rates are not transfer quotes
A market reference rate does not include a transfer provider’s fee, exchange-rate margin, eligibility rules, or delivery method. The recipient amount in a live quote is more relevant to a transfer decision.
Use history for context and the live USD-to-INR comparator for current integrated-provider results. Confirm the final quote directly with the provider.
How to read a long-run USD-to-INR series
First check whether the series reports rupees per U.S. dollar or dollars per rupee; the direction of movement looks opposite when the quotation is inverted. Next check whether each observation is daily, monthly, annual average, or period-end. Comparing an annual average with a single daily rate can produce a misleading conclusion.
The Reserve Bank of India notes that India moved to a unified, market-determined exchange-rate regime in 1993. Financial Benchmarks India later took over computation and publication of major rupee reference rates in 2018. Those methodology changes are part of the history and should be considered when joining datasets.
What history can explain—and what it cannot
Historical data can show long-run direction, volatility, and periods associated with policy or market stress. It cannot prove that one event caused every movement, and it cannot identify the next day’s rate.
For research, cite the specific official series and observation date. For a transfer, compare executable quotes for the same amount because provider pricing, fees, and delivery methods are not represented in a central-bank or market reference series.
Sources
Learn how RemitLow researches and updates content in our editorial policy.
Next step: Plan a USA-to-India money transfer.