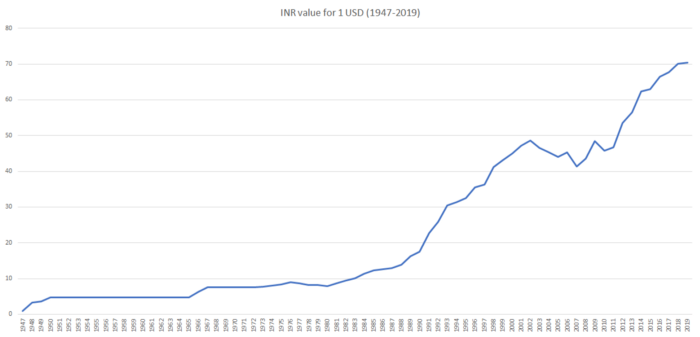
History of INR vs USD
The first US Dollar as we know it today, was printed in 1914 by the newly created Federal Reserve Bank. India’s Reserve Bank on the other hand was established in 1935 and has been issuing Indian Rupee since. Now how exactly are these two currencies related that we are looking into INR’s history compared to USD? When we quote INR against USD, we are essentially quoting India’s Exchange Rate. The exchange rate of a country is an indicator of economic health and overall well-being of its people and hence these are of keen interest in the halls of economic and financial institutions.
But why is that INR is quoted against USD? Why not against Euro or Pound Sterling or Gold for that matter? It is because the US dollar is the most traded currency globally. It won’t be a misnomer to call it the world’s most powerful currency. Around 40% of the world’s debt is issued in USD. To put some more perspective, there are 180 currencies circulating in the world but 90% of forex trading involves USD. So, it’s not just Indian Rupee but all other currencies are compared against USD. Just how USD surpassed Gold and other currencies to become the commodity that other currencies quoted against is a story for another day and an interesting one too! :)
Diving right into the topic now-
1947–1966
India had just gained independence from the United Kingdom and its currency was pegged to Pound Sterling. The rupee dollar rate in 1947 was around Rs 3.30. The Pound Sterling was devalued in 1949, and Indian Rupee being pegged to it, was devalued too making the Rupee 4.76 to a Dollar and it stayed the same until 1966. Unlike today, where the market’s demand and supply influences currency’s worth, the exchange rate used to be fixed back then. A bad economy doesn’t necessarily meant devaluation of the country’s currency and so was the case with India. The first Indian PM had no export strategy in his economic plans for India. There was a big no-no to foriegn trade as that is what brought East India Trading company to India in the first place and started its 200 years of exploitation by Britishers. While there are lessons to be learnt in history, one needs to adapt to changing times. Not having a foreign trade was one of the many flaws of Nehruvian economic policy which cost Indian Economy dearly and ultimately led to Rupee being devalued by 57% in 1966.
1966–1990
India’s current account deficit was in shambles at the start of 1966. It had just fought two wars with China and Pakistan and the inflation rate was soaring. The then PM, Indira Gandhi took a much needed but hated decision of devaluing the Rupee from Rs 4.76 to a dollar to Rs 7.5 in 1966. This was the first devaluation since 1949. Oil crisis of 1973 worsened the situation for Indian Economy as India imported huge amounts of oil which was now much more expensive. And then in 1975, after the Bretton Woods System of Fixed Exchange Rate was abolished, Rupee moved from being pegged to Pound Sterling to being pegged to a basket of currencies. This led to a correction in its exchange rate and it was devalued to Rs 8.9 to a dollar. All along this timeline, India as a nation was wearing out due to political dissension, a spiraling population and of course economic distress. To make matters worse, India’s largest trading partner and importer, Soviet Union, was collapsing in the 1980s. Then there came another crisis in the oil market- the Gulf War of 1990. The oil price shot up owing to this and India withered. The Exchange rate was at its record low rate of Rs 17.5 to a dollar in 1990. At the end of 1990, Indian Foriegn Exchange Reserve could have barely financed three weeks worth of imports. The World Bank agreed to help (not with assistance but with loan) only on the condition that India opens up its economy which paved the way for liberalisation of Indian Economy in 1991.
1991–2001
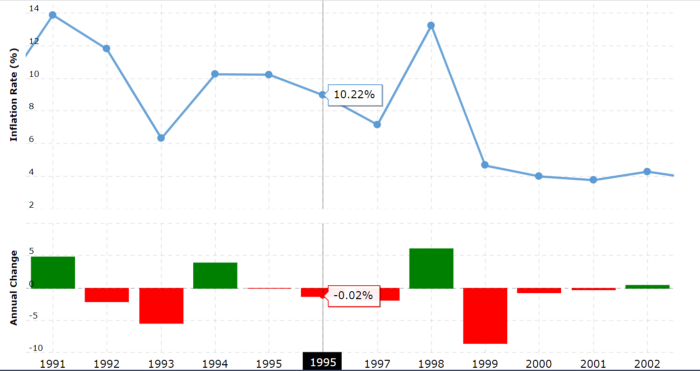
The Liberalisation of the Economy was an important step to counter Balance of Payment issues. But that alone would not have helped much. Devaluing the currency was needed too since it would have made sure to keep exports high. The RBI did just that and decreased the exchange rate by 9% and again by 11% in two days in 1991 and the Rupee was at 22.74 to a Dollar. It was also during this time that Indian Rupee became a market determined Floating Currency. The Exchange Rate continued to decline through most of the decade despite the economic reforms because Inflation Rate and Current Account Deficit were still high and unstable. Other political factors contributed to the depreciation like India conducting the 1998 Pokhran test which established it as a nuclear power but resulted in sanctions by various nations which increased the inflation rate by more than 5% in one year. The exchange rate was at Rs 47.19 to a dollar in 2001.
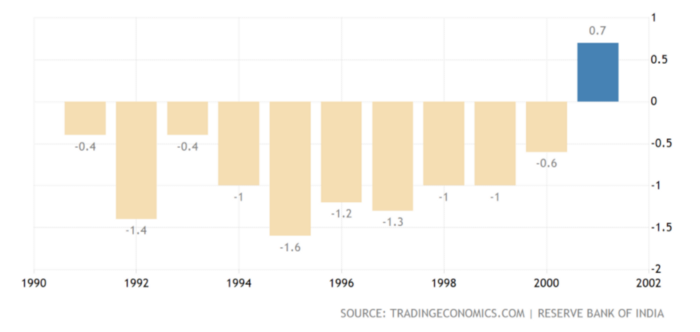
The fruits of liberalizing the economy and implementing sweeping economic reforms by PM Narsimha Rao’s government in 1991 was starting to reap in the early 2000s. In a long long time, India had a positive Current Account Deficit in 2001.
2002–2007
India was doing extremely well economically. The GDP growth was consistently more than 7% in all these years. For the first time in history, its exchange rate started to appreciate and it continued until 2007 when Rupee was at 41.35 to a dollar.
2008–2020
Just when India was climbing the ladder of economic success, in 2008, the fourth largest investment bank in the USA declared bankruptcy. The world’s economy crumpled and the effect was felt everywhere. Investors started pulling out of foreign countries including India and the Rupee depreciated. It recovered quickly and was at 45.73 to a dollar in 2010. However, the next decade saw the Rupee depreciating rapidly. 2010–2020 is often touted as a lost opportunity for India in terms of economic prosperity. The reasons are plenty. PM Manmohan Singh’s government rolled out a number of populist subsidies in the late 2000s at the expense of capital expenditure, the effect of which was seen as a lower growth rate in later years. Industries which are critical for a higher growth saw its contribution to GDP declining over the decade.The inflation started rising in 2012, was at 8.26% in 2016 but has improved since then, being at 4.95% in 2020.
Summary:
The most important factors that have affected the exchange rate of Rupee over the years are inflation rate, current account deficit and geopolitical stability. When India gained independence in 1947, it was depleted of all its resources and had a huge population of poor people to take care of. It opted to be a closed economy and nationalised the majority of important industries both of which was a big mistake and it ended up paying the price of continuing being a poor country. During this time, it even went on wars with its neighbours which had an effect on its economy too. It finally opened up to foreign investment and had capable state-men like Narsimha Rao and Atal Bihari Vajpayee who turned around its economy for good and the INR improved against USD for the first time ever in 2002. Alas, the prosperity did not continue for long. India bore the brunt of bad economic policies by Manmohan Singh’s government in late 2000s and saw the exchange rate depreciating again in the second decade of the 21st century. Surprised demonetization which was not implemented effectively and a bitter medicine to improve the economic environment in the form of GST introduced by Narendra Modi’s government in 2016–2017 did not help the exchange rate either. The Indian Rupee was at 74.13 to a dollar in 2020.
Reference:[1] https://www.imf.org/external/pubs/ft/issues13/#:~:text=The%20shift%20from%20fixed%20to,major%20currencies%20began%20to%20float.[2] https://www.macrotrends.net/countries/IND/india/inflation-rate-cpi